

Usage Reports
Analyse usage statistics of online subscriptions for better insights
Onelog uses its own tracking metrics to compile unique, vendor neutral and customisable reports on all your online subscriptions, helping you negotiate favourable terms with publishers based on actual usage.
Data-driven decision-making based on real usage
Subscriptions can be expensive, so being able to track, monitor and analyse their usage across your entire organisation is essential.
Onelog allows you to accurately track resource usage, how they are being used and who by, giving you a clear understanding of whether these subscriptions provide significant ROI.
Providing essential intelligence on subscription usage

Identify underused resources and reduce costs
Accurately managing your online resources is a simple way to help streamline your company's workflow that can also reduce outgoing costs in the process.
Investing in online resources can be expensive, Onelog can provide you with the relevant tools to help you understand your firm’s usage but also allow for renegotiation with suppliers.

Analyse usage statistics of online resources with detailed reports

Interactive dashboard reports

Built-in admin reports

Data for external Business Intelligence (BI) systems
Data visualisation for all your essential enterprise online services
Interactive dashboard reports
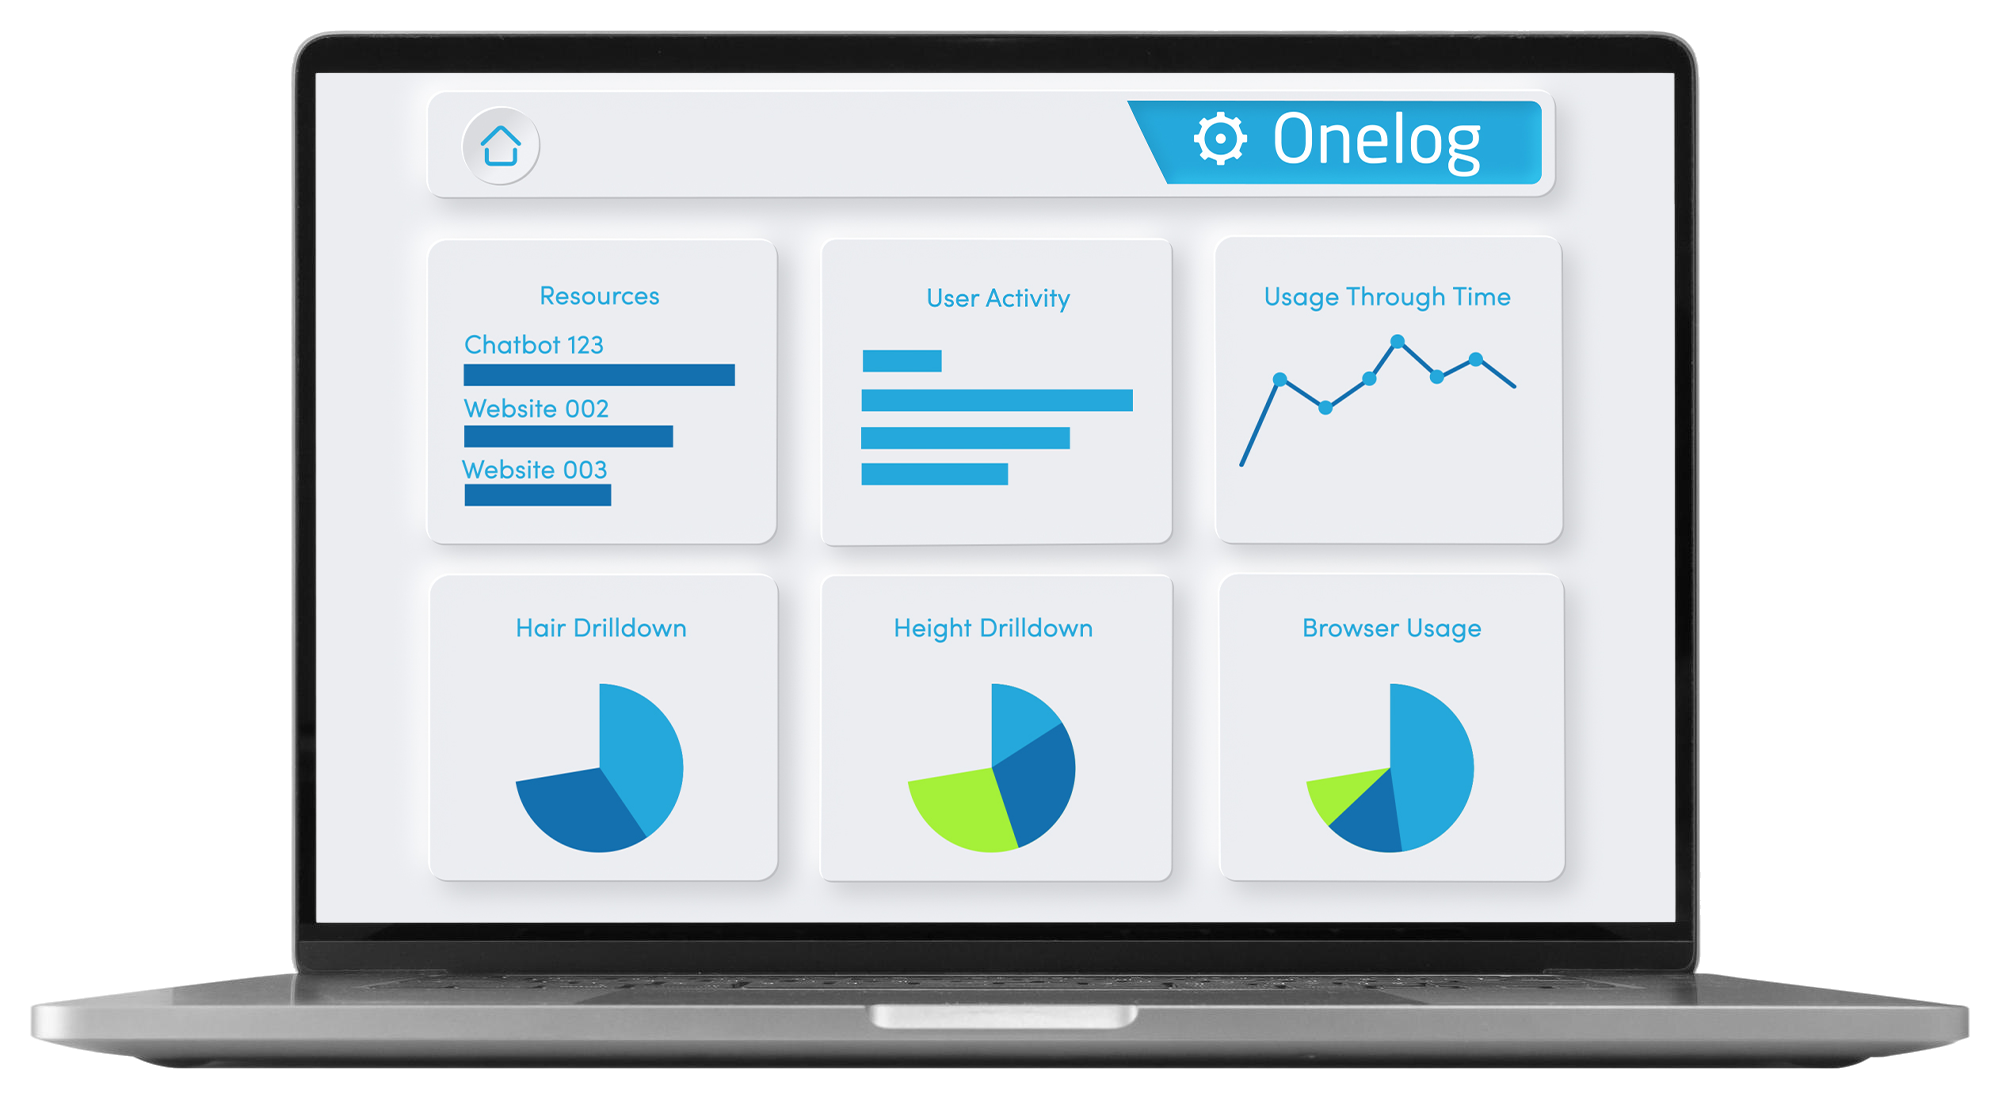
Want to analyse all of your online resource data? Onelog does just that with a simple to navigate interactive dashboard, giving admin users access to all their online subscription usage data in one, easily customisable place.
Customised dashboards and reports also present a clear visualisation to justify your decisions in implementing or removing online resources from your company workflow.
Built-in admin reports available
As well as the interactive dashboards reports, Onelog also provides you with granular reports available to you via the reports admin – below are some examples of reporting with your Onelog system:
Gain transparency of your online subscriptions
-
Resource usage summary
This shows a summary of utilisation for a resource.
Resource usage detail
This gives a detailed list of each user’s sessions.
Resource limited licence exceeded
This list includes all resources and users where access has been denied due to there being insufficient pooled passwords or a limited concurrent licence.
Unused resources
This is a list of resources which have not been used by any user. It helps to identify resources which are no longer required.
Report raw data
This provides a CSV report which contains all the user session data so that it can be processed by a 3rd party application, such as Excel.
Resource configuration
This provides a CSV report that contains a list of all resources and their configuration.
Resource web control configuration
This provides a CSV report that contains a list of all web controls and their configurations.
-
User usage summary
This shows a summary of each user’s resource utilisation.
User usage detail
This shows a detailed list of each user’s sessions for each resource.
Unique user usage
This is a line chart showing the number of users who have used a resource at least once.
Unused user resources
For resources that are set up with individual passwords, this lists users that have not accessed them within the given date period.
-
Group usage summary
This summarises usage per group, showing the number of resources accessed, sessions, duration and page count.
Group usage detail
This shows a detailed list per group, showing session details including IP Zones, resource name, matter numbers*, timekeeper IDs*, comments*, duration, page count and cost* (*where recorded).
-
All passwords
This shows a list of all resource passwords.
User passwords
This lists all passwords for resources which are configured to require individual user passwords.
Organisation passwords
This lists all passwords for resources which are configured to use firm-wide passwords.
Pooled passwords
This lists all passwords for resources which are configured to use pooled passwords.
Compliance report
Shows all events over the chosen date period when more than one person uses the same username and password to access a resource.
-
Peak resource usage
This shows a line chart of the highest number of concurrent sessions per resource within the selected date period.
Total user session usage
This shows a line chart of the total number of sessions per resource within the date period selected.
Unique user session usage
This shows a line chart of the number of individuals using each resource within the date period selected.
Total session duration
This shows the total usage duration per resource within the date period selected.
-
Analysis resources
This shows the number of unique users who have used the resource(s).
Analysis search
This shows the number of times each search term has been used with each resource.
Analysis matter
This shows the number of times each matter number has been used with each resource.
Analysis resources sections
This additional report is run via the Reports section and shows a list of resources and the number of times each section was accessed.
-
IP Zone usage summary
This summarises usage per IP Zone/Location, showing the number of resources accessed, session, duration and page count.
IP Zone usage detail
This shows a detailed list per IP Zone/Location, showing session details including IP Zones, resource name, matter numbers*, timekeeper IDs*, comments*, duration, page count and cost* (*where recorded).
Local filter sections
This shows details for each local filter, which analysis sections have been used while researching in a resource.
Leave no subscription use unturned with Onelog’s built-in reports.
Identify where resources are better implemented…
Onelog gives you the option to draw usage data dependent on a user, group or location.
Understanding how resources are used within your company may mean using them differently for each user, department or region.

Business Intelligence (BI) systems integration
From print data to customer feedback, BI is becoming a key player in the handling of online resources and company decision making via it's easy to capture and apply data visualisation.
Use Onelog to generate data that is suitable for Business Intelligence systems such as Microsoft Power BI for in-depth analysis of complex usage data as well as faster, more proactive decision-making.